
Making the BC Public Service more diverse
May 30, 2025

British Columbia is home to many diverse communities, but long-standing systems and structures, racist policies and barriers mean Indigenous and racialized people are underrepresented in the BC Public Service compared to the B.C. population. This underrepresentation is even more significant at the management and executive levels.
To address systemic racism in government services, the BC Public Service must have better representation of the diverse communities we serve.
We can better design and deliver services that work for everyone in the province when government policies and programs are shaped by a variety of expertise, lived experience and perspectives.

The research
In 2023, the Province, in collaboration with the Anti Racism Data Committee and Indigenous Peoples, identified 10 anti-racism research priorities. This research falls under the priority related to racial diversity and equity in the BC Public Service.
To support this work, a research team looked at diversity in the BC Public Service to understand current levels of representation across the organization and see where Indigenous and racialized communities may be facing barriers to accessing senior roles. Addressing these barriers helps the BC Public Service to better reflect the population of B.C., especially for roles that lead and make decisions about policies and programs.
In May 2024, the Province released findings about representation across the BC Public Service. This information was based on employee surveys and human resources data collected in 2022.
We’ve updated our findings using surveys from 2024. Researchers from the BC Public Service Agency looked at the number of Indigenous and racialized employees to understand representation across different roles within the BC Public Service. This includes:
- Executive accountable for ministries achieving their goals (for example, deputy ministers and assistant deputy ministers)
- Management accountable for achieving goals for a specific team or area in a ministry (for example, directors)
- Non-management, such as unionized positions, including a broad range of roles (for example, technical, research and policy, financial, scientific, social service or front-line positions)
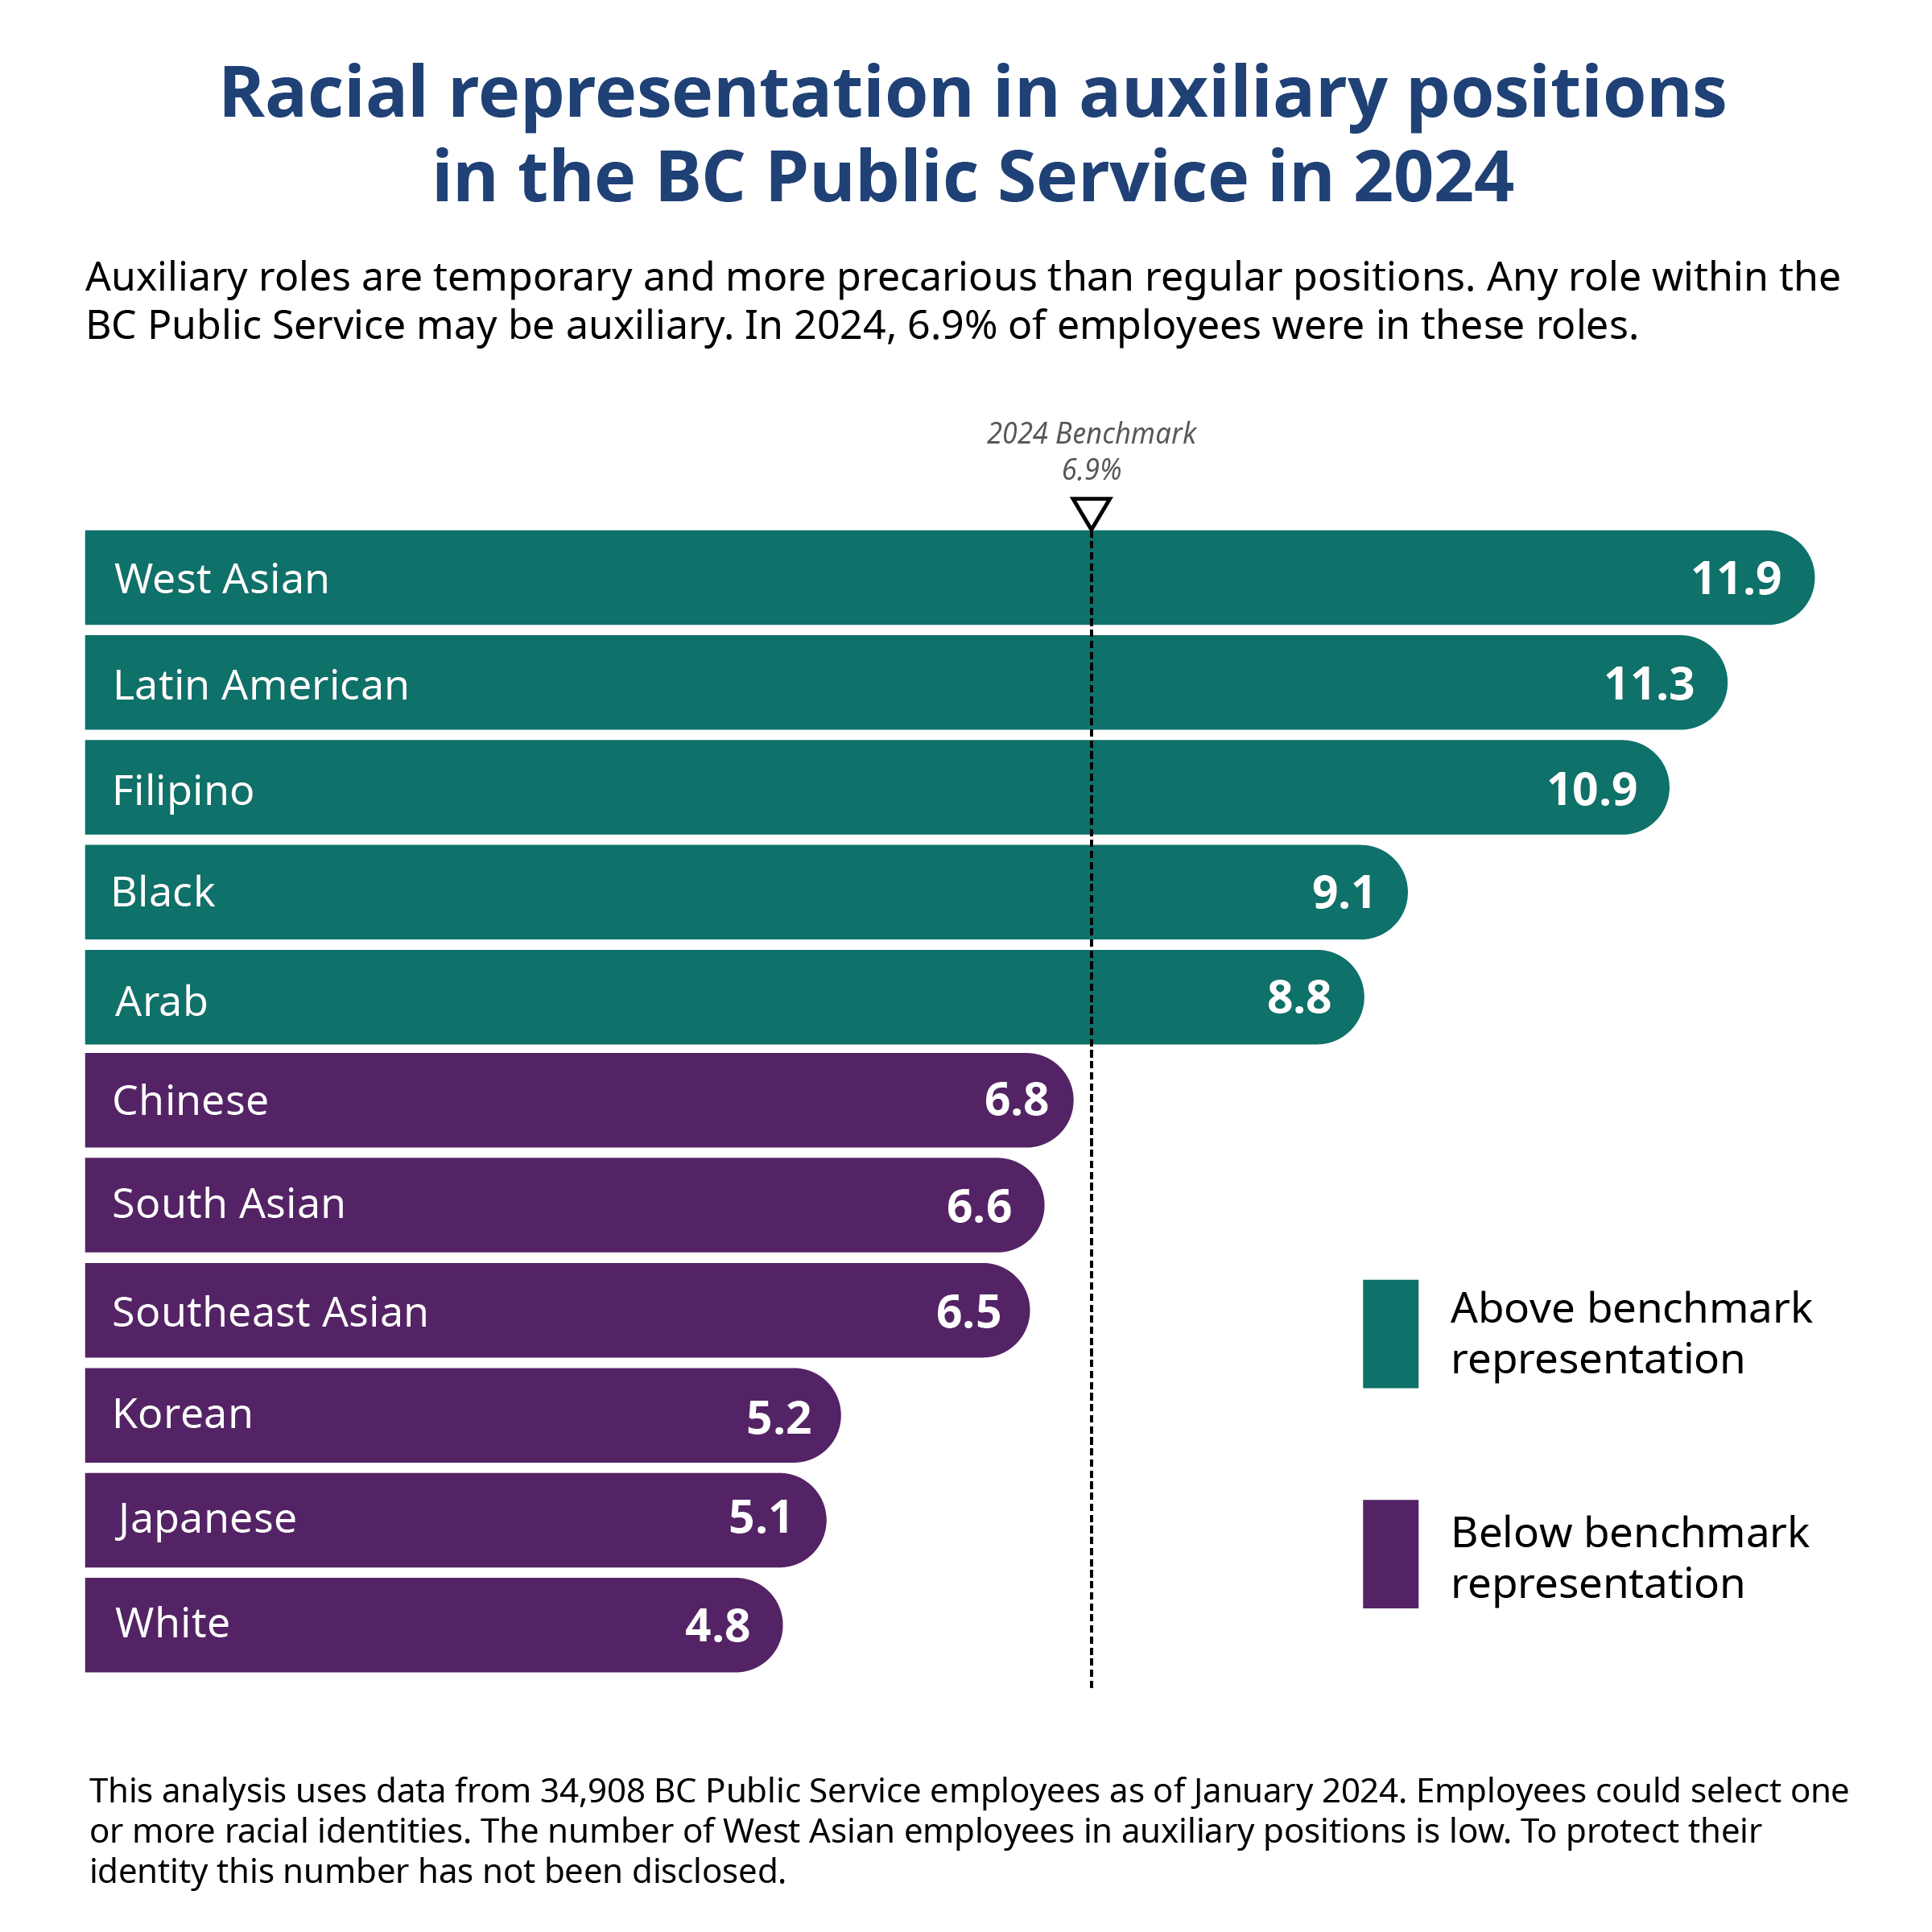
Employees in these roles may be in permanent or auxiliary positions. Auxiliary positions are temporary positions used for short term or seasonal roles. As such, they provide less financial stability and security, as well as limited access to benefits and paid vacation compared to permanent positions.

What we learned
In 2024, the BC Public Service employed more than 34,900 people who completed employee surveys. For staff in 2024:
- 18.4 percent of employees were in executive positions (0.6 percent) and management positions (17.8 percent)
- 81.6 percent were in non-management roles
- 6.9 percent were in auxiliary positions
The team used the percentage of all employees in each role within the BC Public Service as a benchmark and looked at the percentage for each demographic group to understand if it was above or below that benchmark.
The level of representation from the 2024 data is similar to research conducted in 2022. These most recent findings show Indigenous and racialized individuals continue to be underrepresented in the BC Public Service. This underrepresentation is even more significant at the management and executive levels.
By contrast, white employees continue to be overrepresented at the executive and management levels. These positions typically involve responsibility and accountability for employees, budgets and strategic goals. They earn a higher salary and are more likely to have the power to inform government decisions.
While representation may shift over time, the similar data between 2022 and 2024 suggests more targeted strategies are needed to create a more diverse and equitable public service. Read more about how government is taking action in the what’s next section.
Indigenous employees
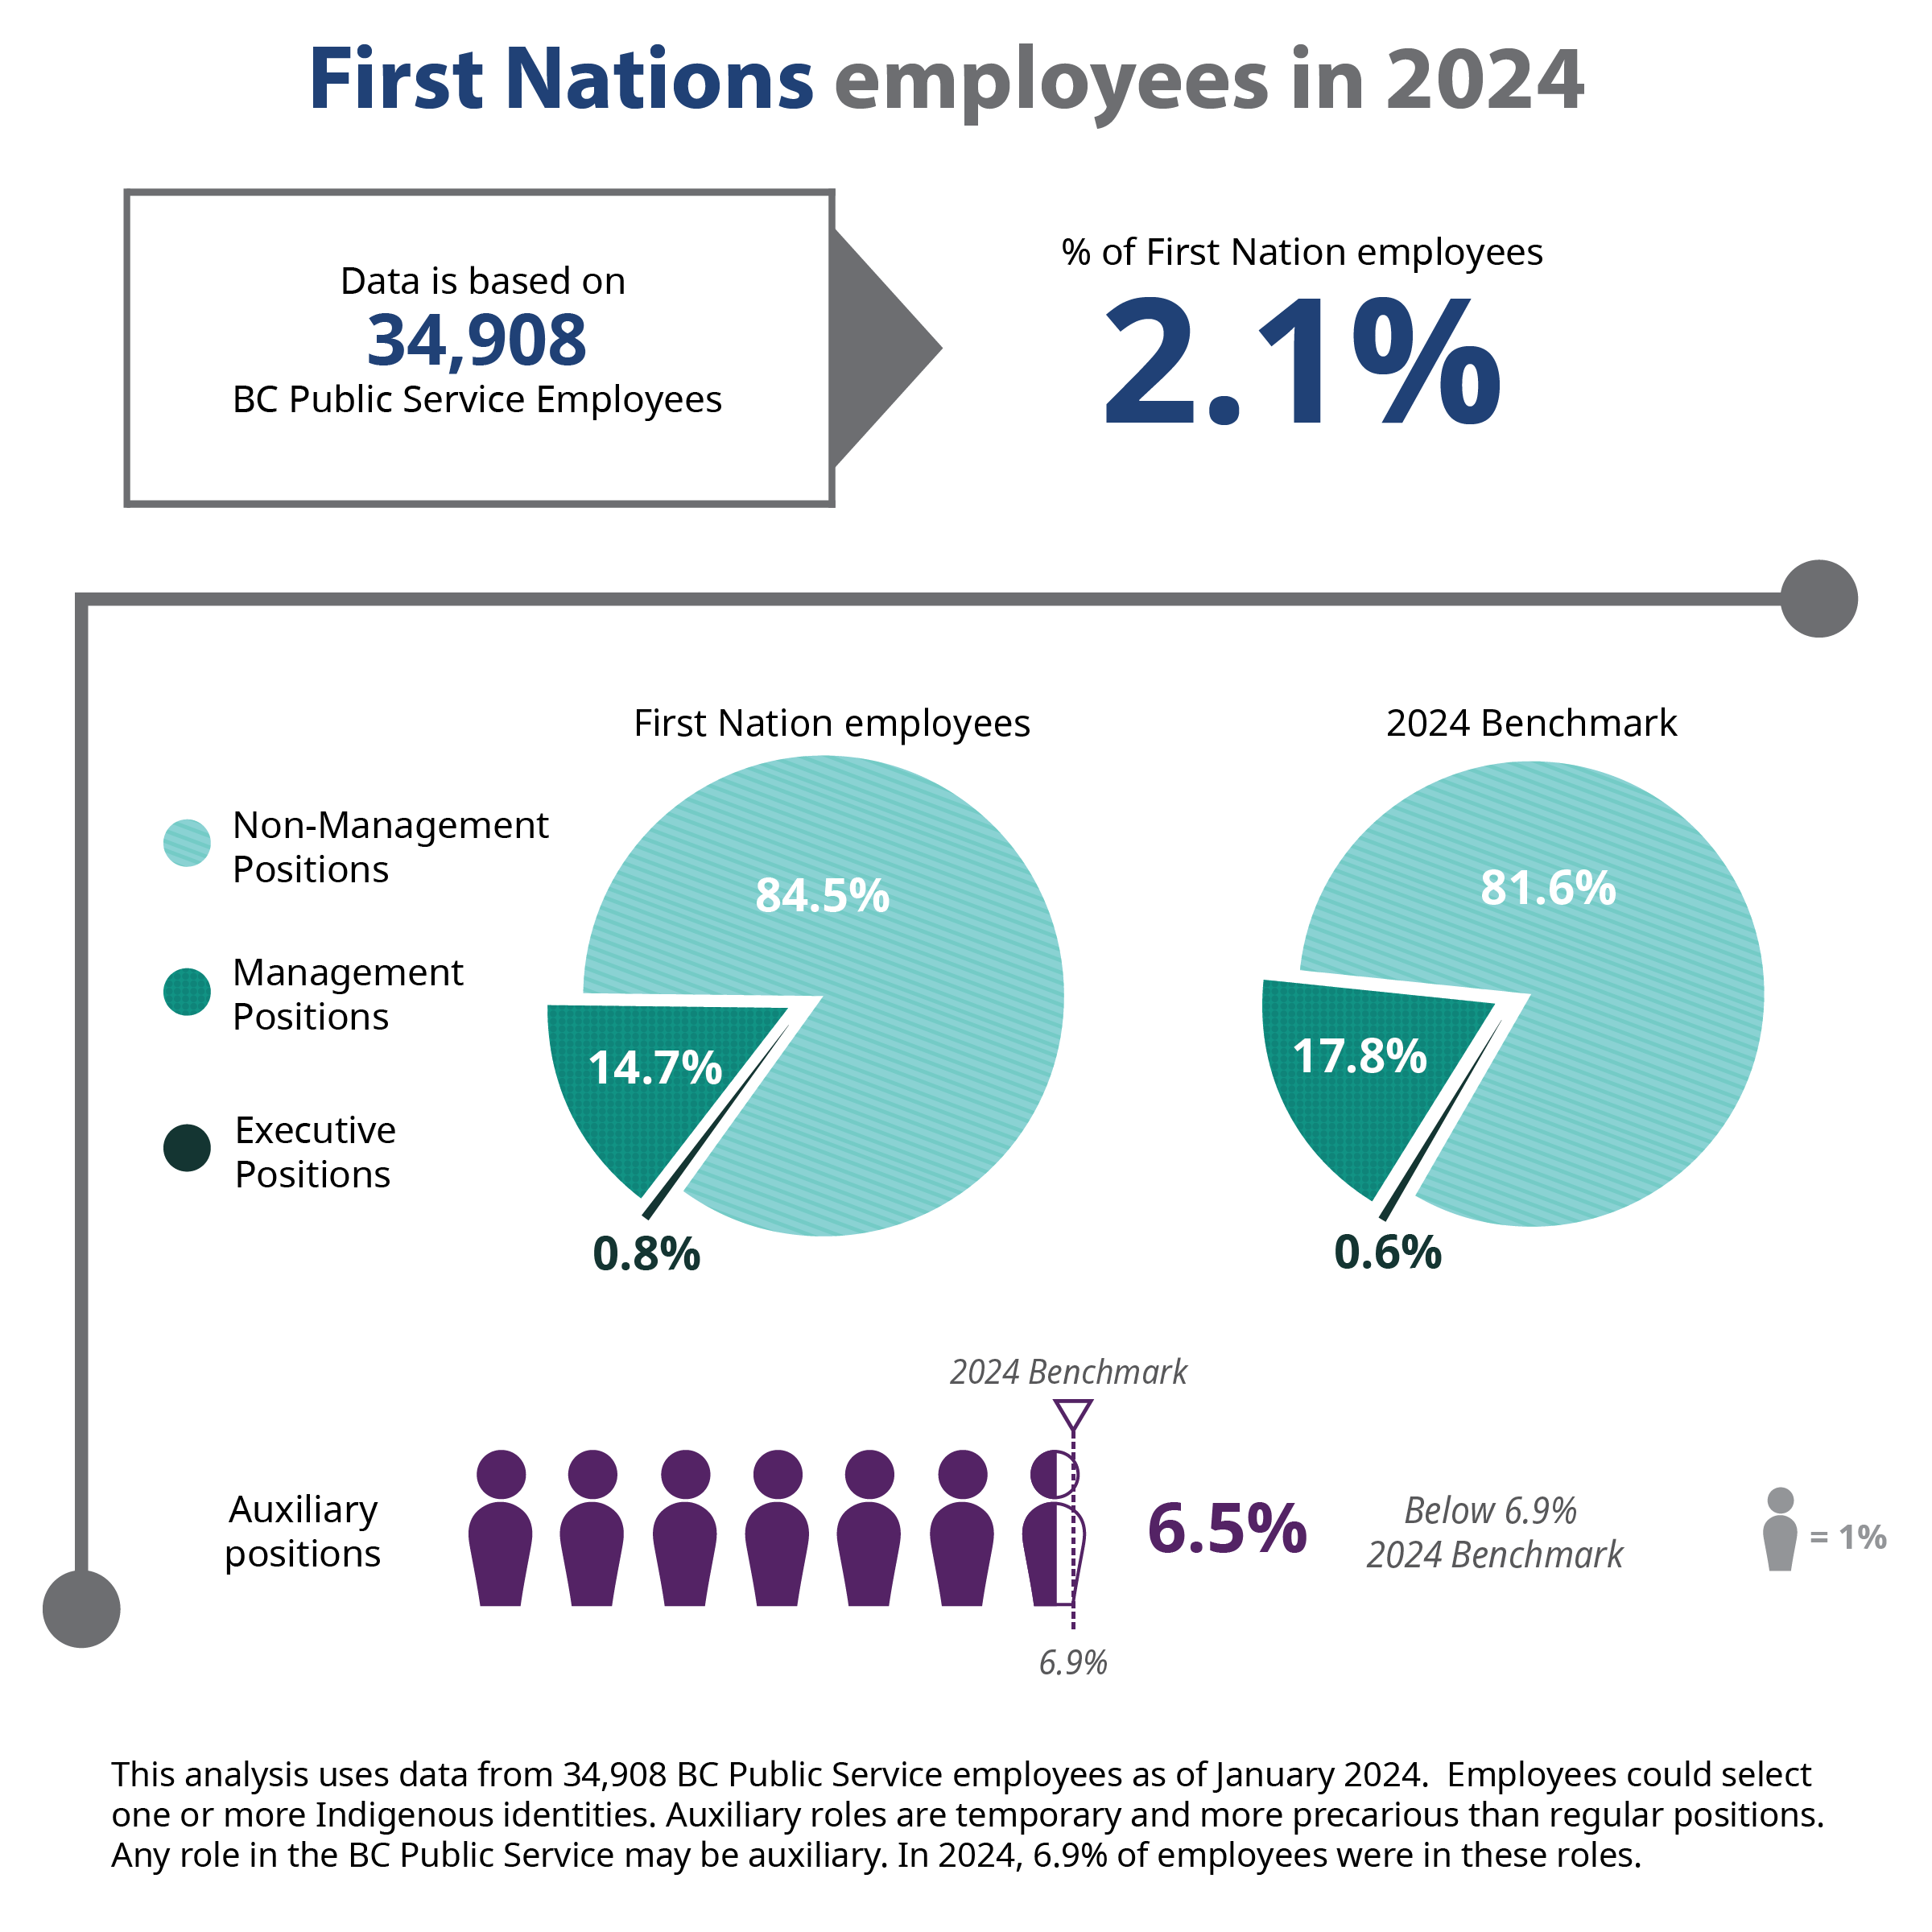
First Nations people working in the BC Public Service are underrepresented at executive and management levels.
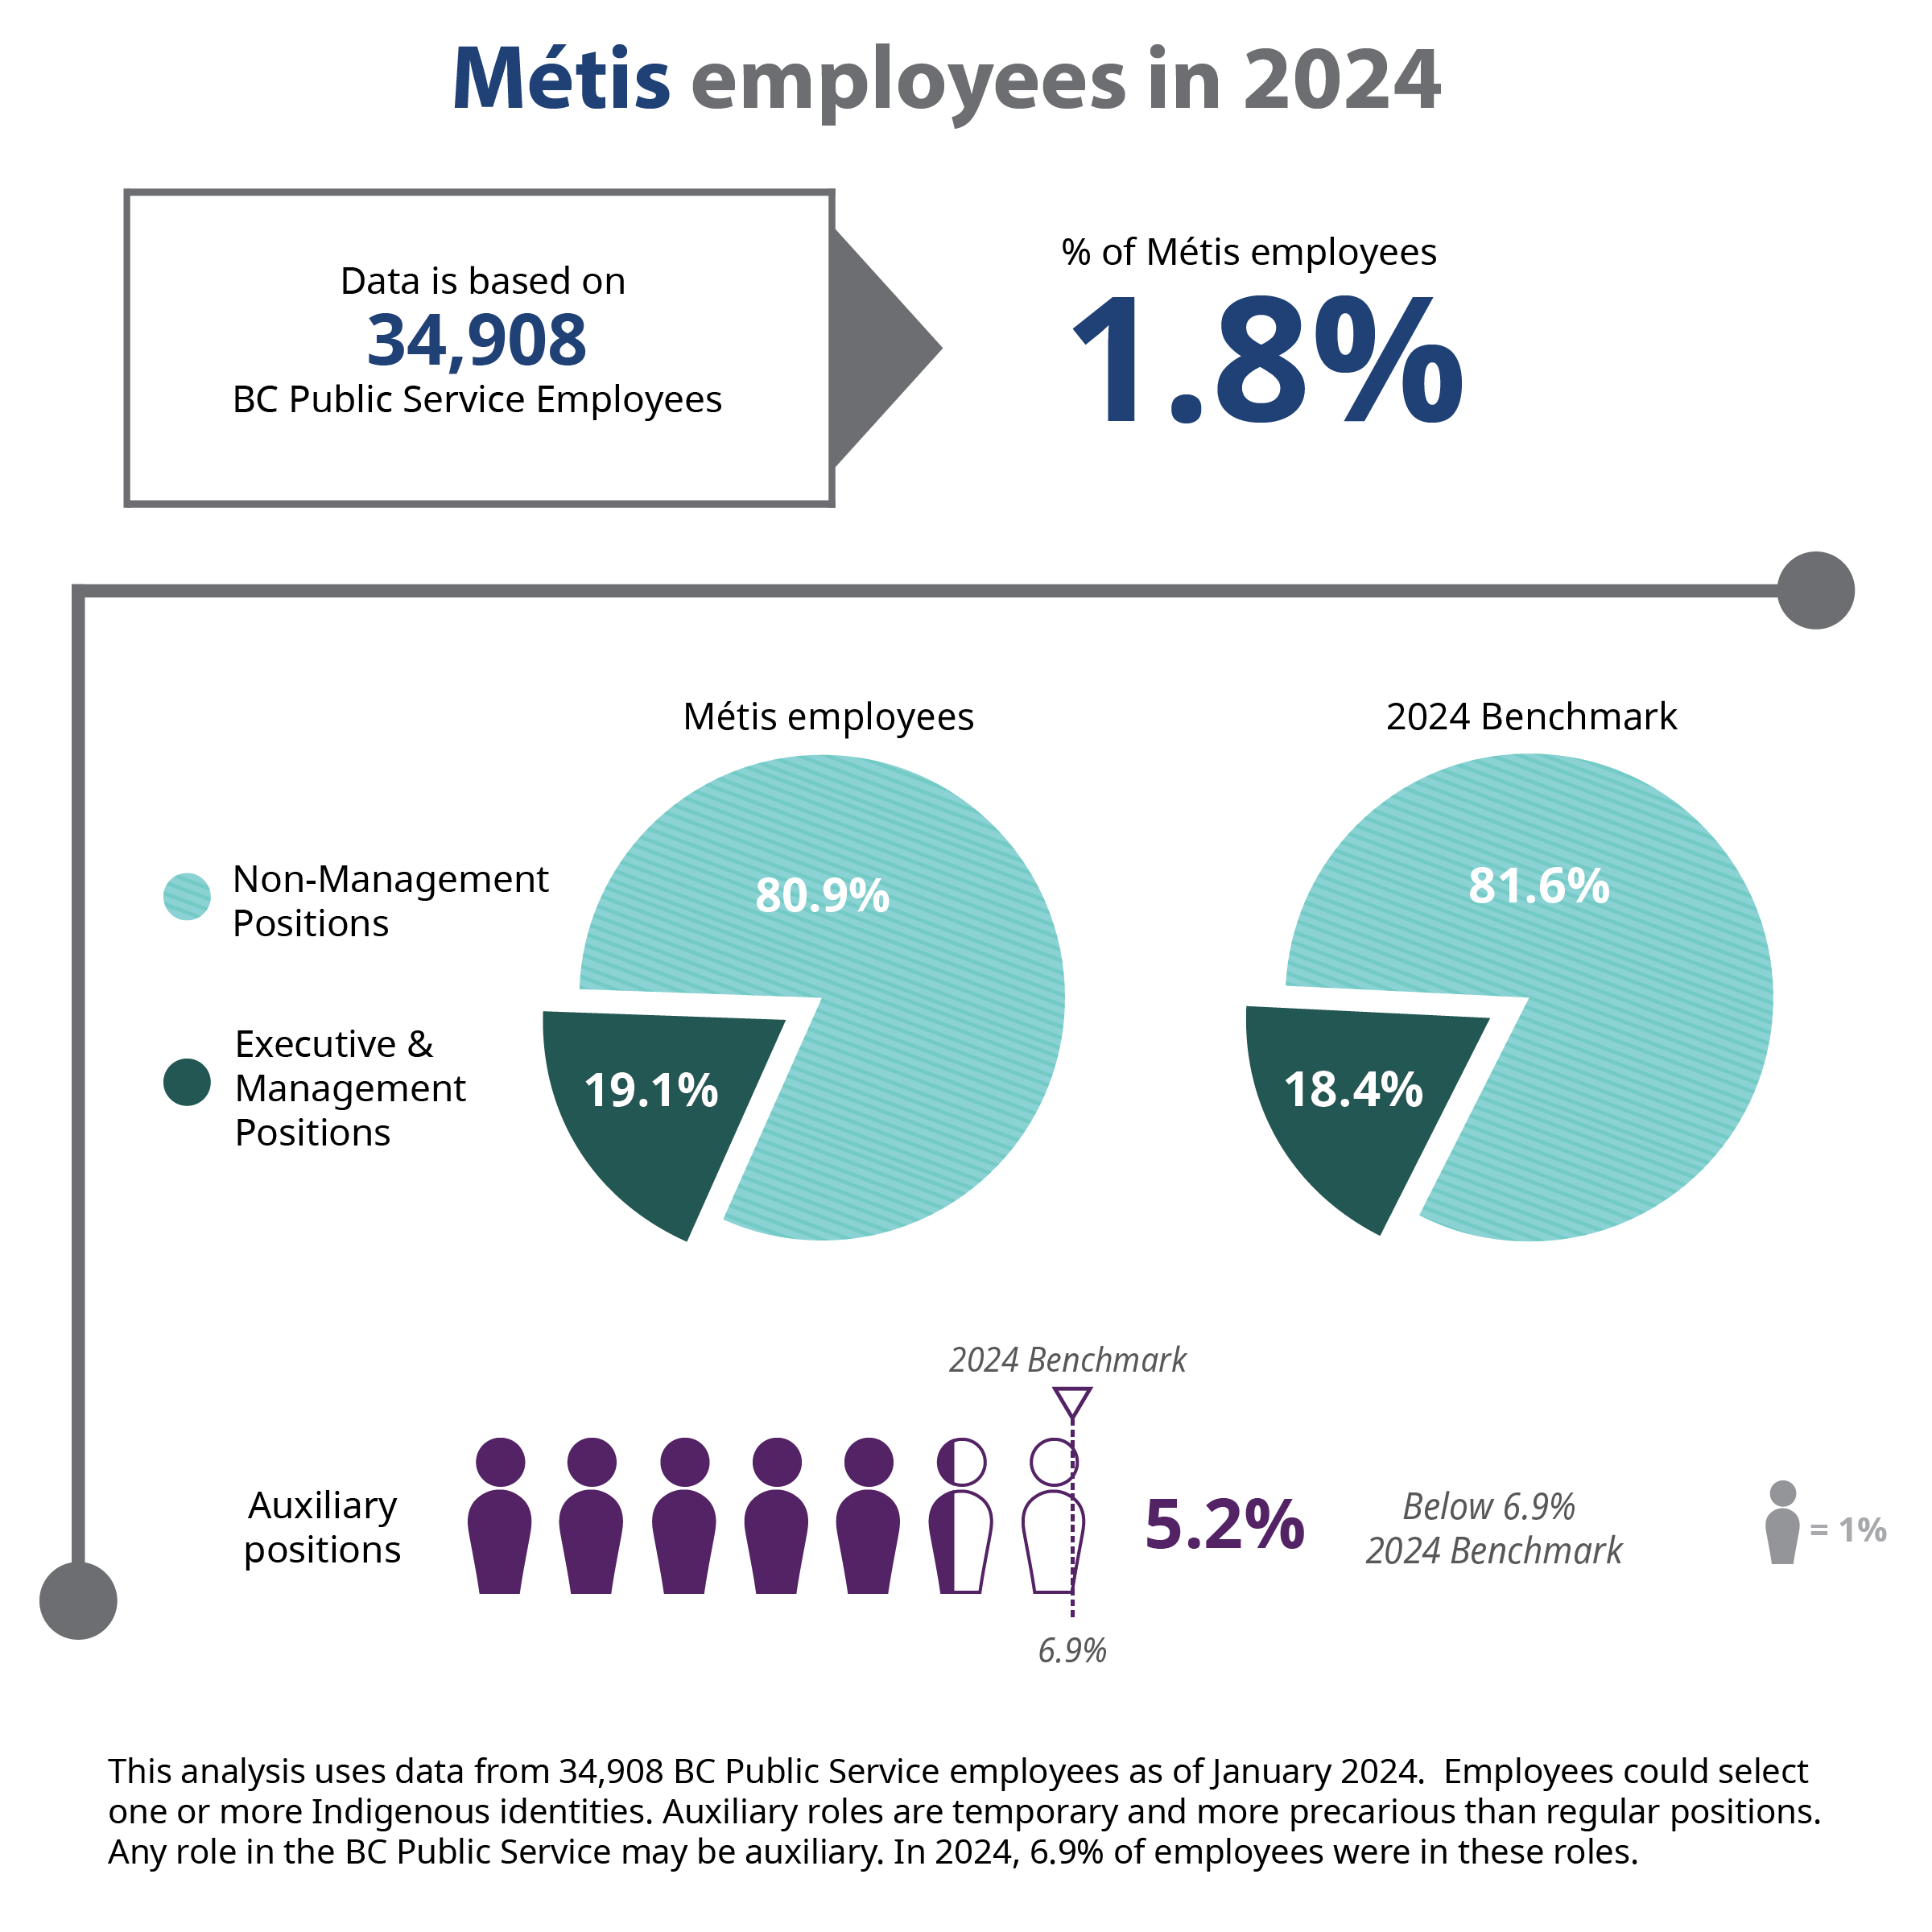
Métis employees are represented at a slightly higher rate in executive and management roles than the benchmark for the BC Public Service.
The number of Inuit employees in the BC Public Service is low. There are no Inuit employees at the executive level in the BC Public Service. Almost half of Inuit employees are in a management role. However, this is inflated due to the small sample size as one employee may have a significant impact on percentages. This makes it harder to provide a meaningful comparison to benchmark levels across the BC Public Service.
Compared to the benchmark of 6.9 percent, there are slightly fewer First Nations and Métis employees in auxiliary roles. There were no Inuit employees in auxiliary roles in our sample.
Racialized employees
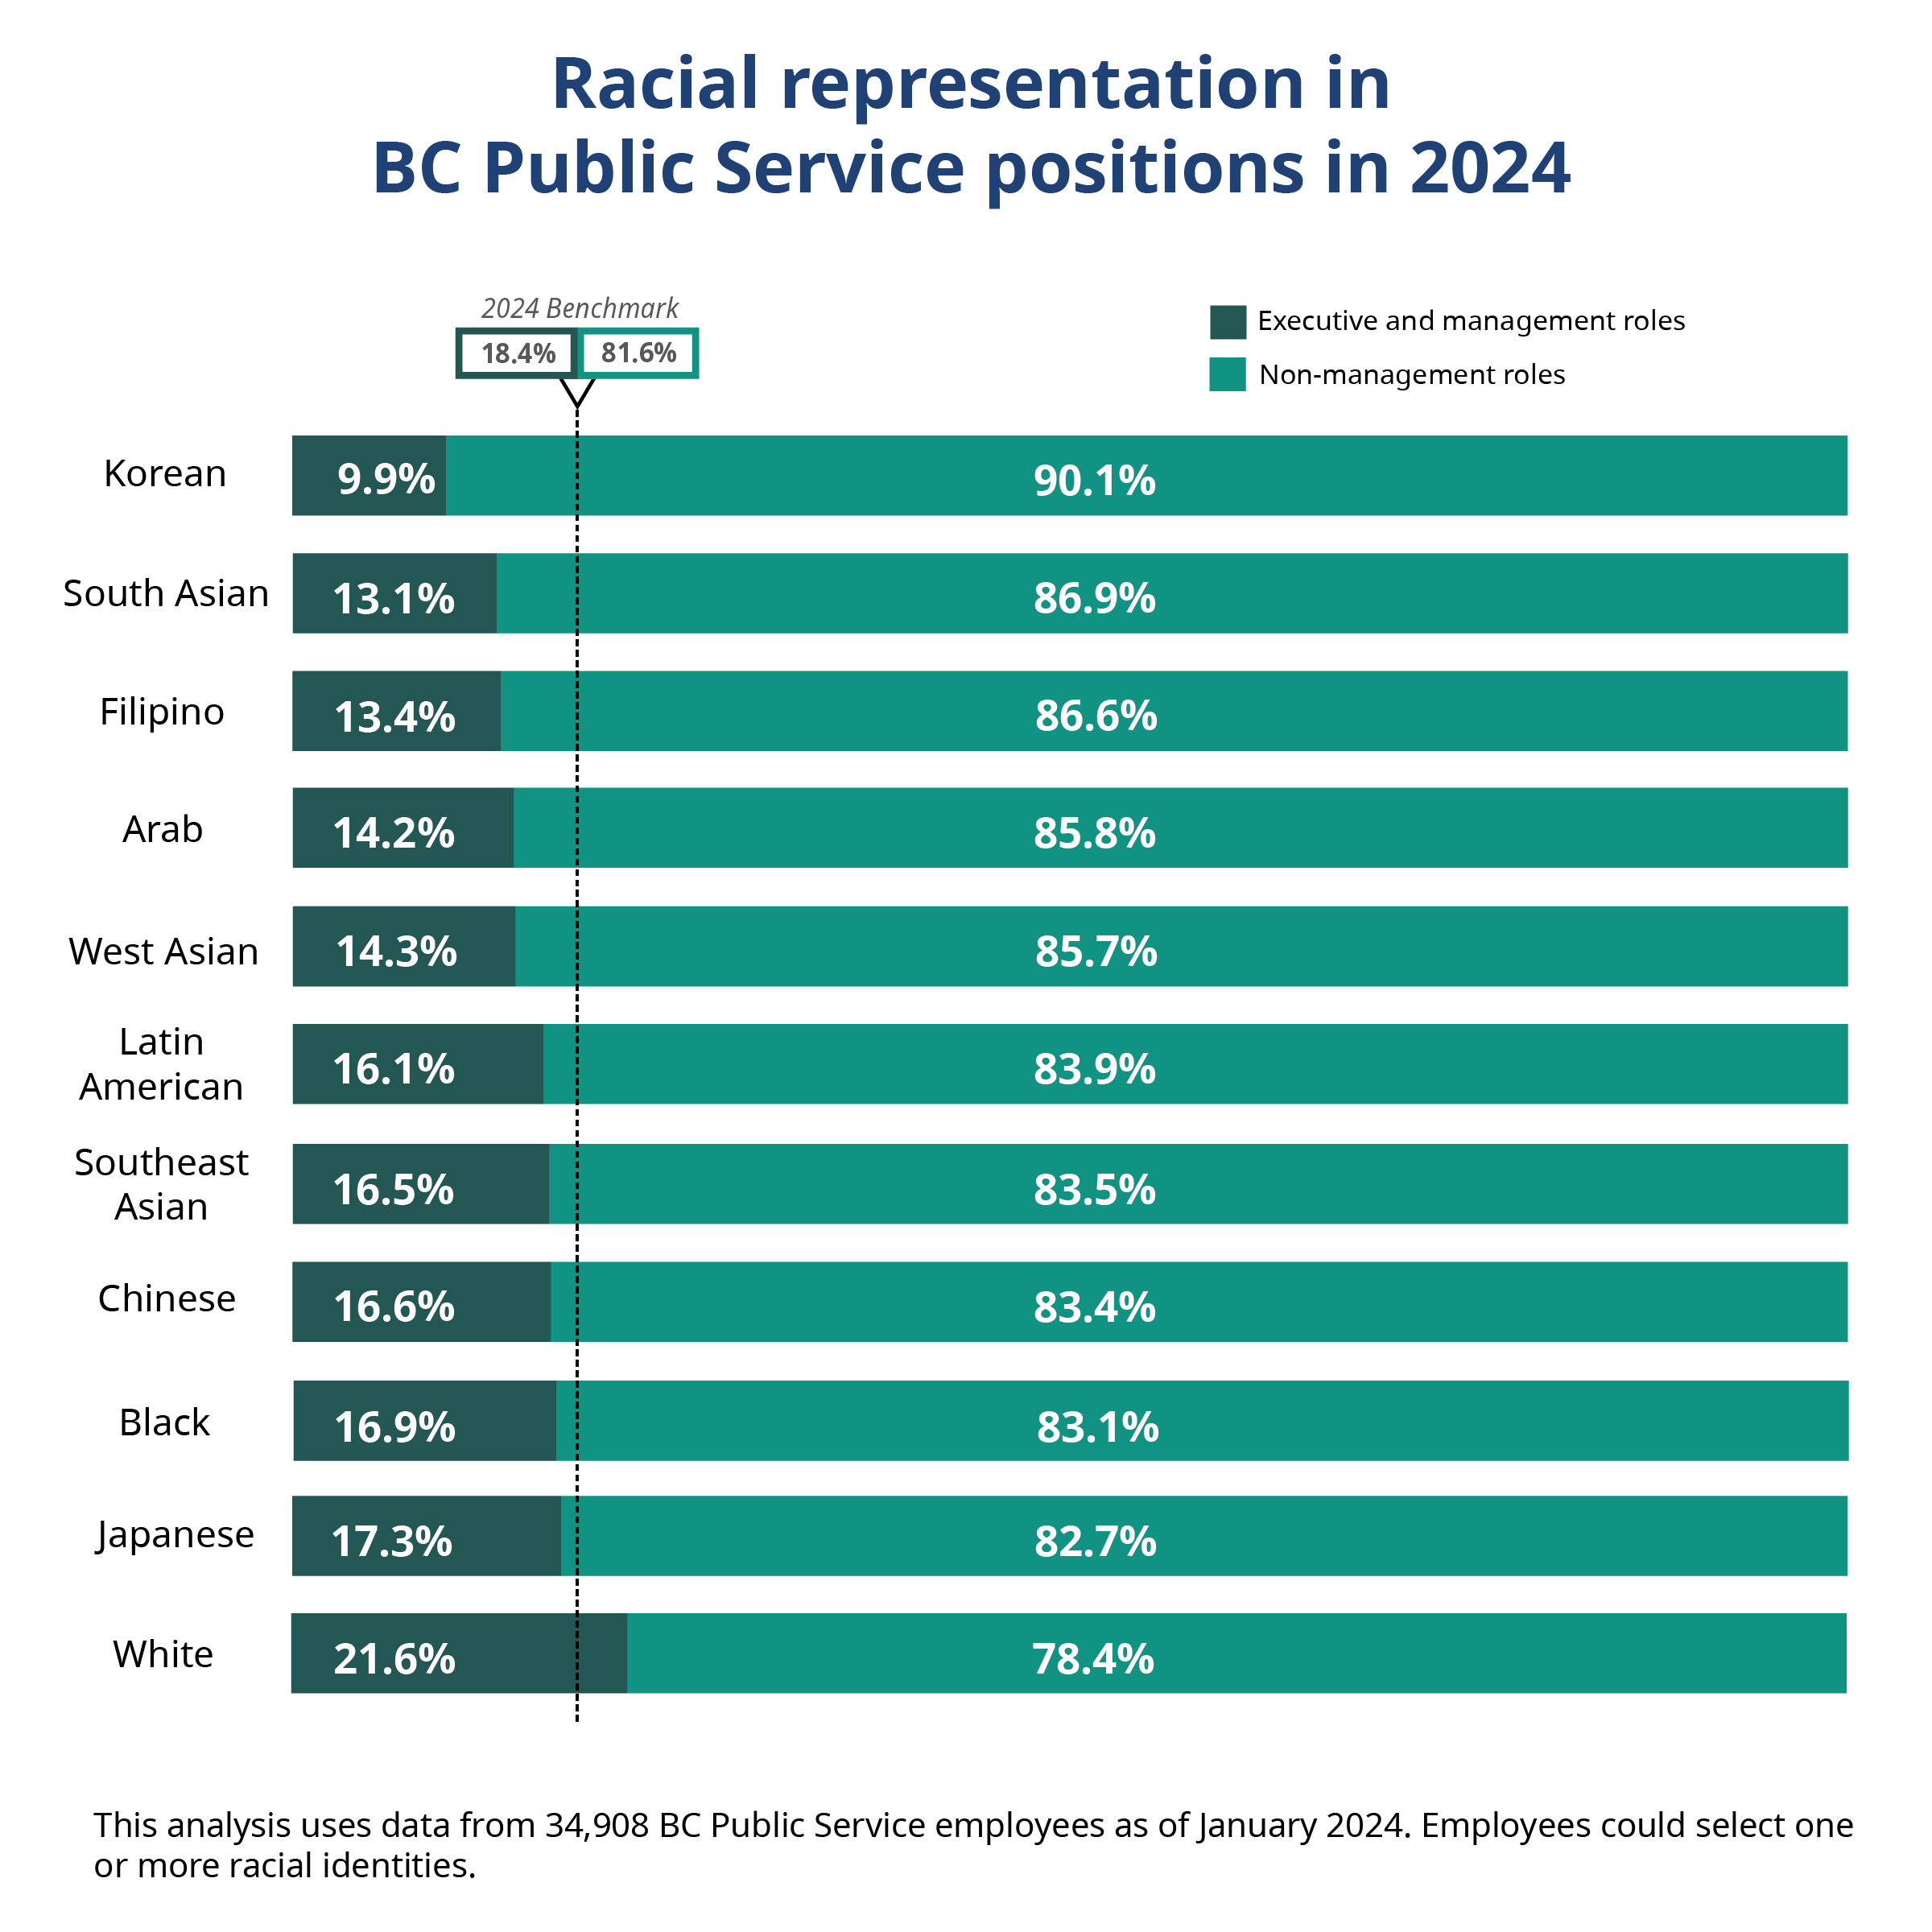
At 21.6 percent, white employees hold the largest number of executive and management roles in the BC Public Service.
The percentage of Black, Chinese, Japanese, Latin American and Southeast Asian employees in executive and management roles is slightly below the BC Public Service benchmark, within 3 percent.
Arab, Filipino, South Asian and West Asian employees were more than 3 percent below the benchmark in executive and management roles. The percentage of Korean employees in executive and management roles was 9.9 percent.
At 11.9 percent, there are almost twice as many West Asian employees in auxiliary roles than the benchmark for the BC Public Service. Arab, Black, Filipino and Latin American employees are also overrepresented in auxiliary roles.

What’s next
The BC Public Service has been shaped by colonial and racist policies. It takes time and effort to change long-standing systems, behaviours and attitudes. This research is an initial start, drawing attention to racial equity in the BC Public Service by providing an updated snapshot of Indigenous and racialized people’s under representation in the BC Public Service.
These findings call us to take action to make systemic changes and advance racial equity in the BC Public Service. Future phases of research will focus on understanding where Indigenous and racialized employees are facing barriers so that efforts can be made to remove them.
The BC Public Service Agency is dedicated to improving representation of Indigenous and racialized employees in the BC Public Service. We also acknowledge we need improved resources for Indigenous and racialized employees to grow their careers. For this reason, our efforts are aimed at improving and expanding existing programs, such as the Indigenous Leadership and Mentorship Program.
This program has been highly successful at recruiting mentors from across the BC Public Service to support Indigenous employees with their leadership development and career advancement. At the heart of the program’s design, we ensure Indigenous participants have continuous opportunities to provide feedback on their career development needs. Based on this feedback, we have now expanded programming to include culturally safe and confidential Indigenous coaching.
We hope to build on the success of these programs and are exploring options to support leadership and mentorship of racialized employees.
Learning and development opportunities
We’ve recently introduced anti-racism and equity-focused resources to support ongoing conversations and learning among BC Public Service employees. This includes the Anti-Racism in the BC Public Service learning pathway, which was released in 2024.
As part of the Declaration Act Action Plan commitment 3.1, we’ve been working diligently with Indigenous partners to co-develop a new mandatory learning course, Indigenous-Crown Relations Essentials. The course helps BC Public Service employees understand their responsibilities in upholding the rights of Indigenous Peoples.
The course explains key terminology, identifies colonization as the root of anti-Indigenous racism and identifies how anti-Indigenous racism was used to justify laws. We’re focusing on how to support the delivery of this mandatory course across the BC Public Service without creating new harms to Indigenous employees.
The online course Diversity and Inclusion Essentials has been mandatory learning in the BC Public Service for several years. This course conveys the responsibilities of employees to maintaining a workplace that is free from discrimination, includes definitions of anti-racism and offers a values-based approach to inclusion.
In addition, training has been made available to ensure that hiring managers are aware of and consider inclusive hiring practices, including preference statements, considering lived experience and ensuring hiring panels have diverse representation.
Indigenous and racialized employees are central to the conversations around this work. The BC Public Service Agency will be engaging with employees across the organization to understand their experiences and the barriers they’re facing along their career pathways. This information will inform the updated corporate equity, diversity and inclusion strategy, Where We All Belong, releasing in 2025.
Learn more
This web page is a simplified summary of the research into representation within the BC Public Service. Read the technical report to learn more about this research, including how the analysis was done and detailed findings about specific population groups and job roles.